


In 2020, I got less gas.
As a result of the global pandemic, I didn’t drive my car, a 2013 Mini Cooper Clubman, much. My last regular work-week was at the end of February. I then flew to a work conference during the first week of March, returned via train, and immediately began working from home. A college course I teach went to online learning. Even occasional short trips to the grocery store were usually made in my wife’s SUV, so we could stock up and therefore go less often.
Driving picked up toward the end of the year. After buying a new house about 12 miles from the old one, I made many trips between the two, doing work. I also made one 460 mile roundtrip to my hometown.
Fuel consumption and miles driven dropped about 40 percent between 2019 and 2020, and owing to lower gas prices, money spent dropped by more than half. Average miles-per-gallon in 2020 was higher than it’s been over the life of the car. I filled the tank 23 times in 2019, but only 13 in 2020.
Note: Some data was lost spanning the end of 2019 and beginning of 2020. See Methodology section for details.
My car’s fuel consumption dropped more than 40 percent — from nearly 300 gallons in 2019 to about 169 in 2020. In the six full years I’d owned my car prior to 2020, I’d never bought less than 200 gallons.
My total expenses for gas dropped by about half, from $773 in 2019 to $383 in 2020. The quantity I bought only went down 40%, but the average price dropped too — I paid an average of $2.58 / gallon in 2019, but only $2.27 / gallon in 2020. Between 2014 and 2019, I’d never paid less than $550 to fill the tank for the year.
I drove about 4,000 fewer miles. In 2019, I drove about 9,485 miles, but in 2020 I drove just 5,435. This again is a significant drop-off during the life of the car. Between 2014 and 2019, I’d never driven under 7,000 miles in a year.
My average miles-per-gallon went up as well. In 2020 I got about 32.33 miles per gallon. I’d never cracked 32 before, though 2019 hit 31.96 mpg. This can likely be attributed to a greater percentage of my miles being long-distance driving. In 2020, more than 40% of my total miles driven can be attributed to trips to the college I teach at and the one long trip to my hometown. In 2019 long trips accounted for less than 40% of the total miles driven.
I most often fill the tank when it’s nearly empty. In 128 out of 136 purchases, the average amount purchased was 13.28 gallons, with a standard deviation of .69.
I try to log all my gas purchases, and am mostly successful. Over the 7+ years I’ve owned my current car, I’ve logged information for 136 fuel purchases. Most of these include date, gallons purchased, price per gallon and current odometer reading.
However, due to a technology error1, information was lost for an assumed eight fill-ups between 2019–09–21 and 2020–02–05.
I am assuming eight purchases were lost for two reasons:
I was able to recover the mileage only for three of these events, so the odometer gap is only five purchases. This gap is 2,336 miles — dividing by six (that’s five unknown fill-ups) gets 389.3 miles. This would be in the upper 20th percentile of all known distances driven on one tank of gas. Attempting to distribute the 2,336 miles over four fill-ups gets more than 467 miles per tank, which would be in the 90th percentile.
For the eight transactions, I simply assumed the amount of gas purchased each time was the average amount I’d purchased over the life of the car — 13.275 gallons. As mentioned, this number is fairly stable — a standard deviation of about .7 gallons.
From the credit card records, I had the total amount of the purchase. I divided this by the estimated amount purchased.
As I said, I was able to recover mileage for three of the eight fill-ups. Therefore the gap where the mileage is unknown is five. I evenly distributed the total miles driven among these five, resulting in an odometer increase of 389 miles for each fill-up.
Five of the eight purchases missing data were in 2019, with the balance in 2020.
The 66.36 estimated gallons purchased is 22.2 percent of the total amount of gas in 2019 (including the estimated amount). For 2020, the 39.8 estimated gallons represent 23.6 percent of the total.
The mileage and gallons work out to 29.3 miles per gallon for the estimated data. This would be significantly lower than average — just under the 30th percentile for the known 2019 data and just under the 20th percentile for the known 2020 data.
I created a Shortcut on my iPhone that would fill in the date and ask me for the gallons, price and mileage, then send this info to a CSV file in Dropbox. Somehow the connection was lost so that the shortcut appeared to work correctly but the data was not saved in the file. ↩
Today’s neat discovery: Reading an article about the rewrite of Indiana Jones and the Last Crusade, somehow the name Denholm Elliott — Brodie in that film and in Raiders — got me to connect him to an obscure movie he was in 30+ years earlier that I like: The Holly and The Ivy.
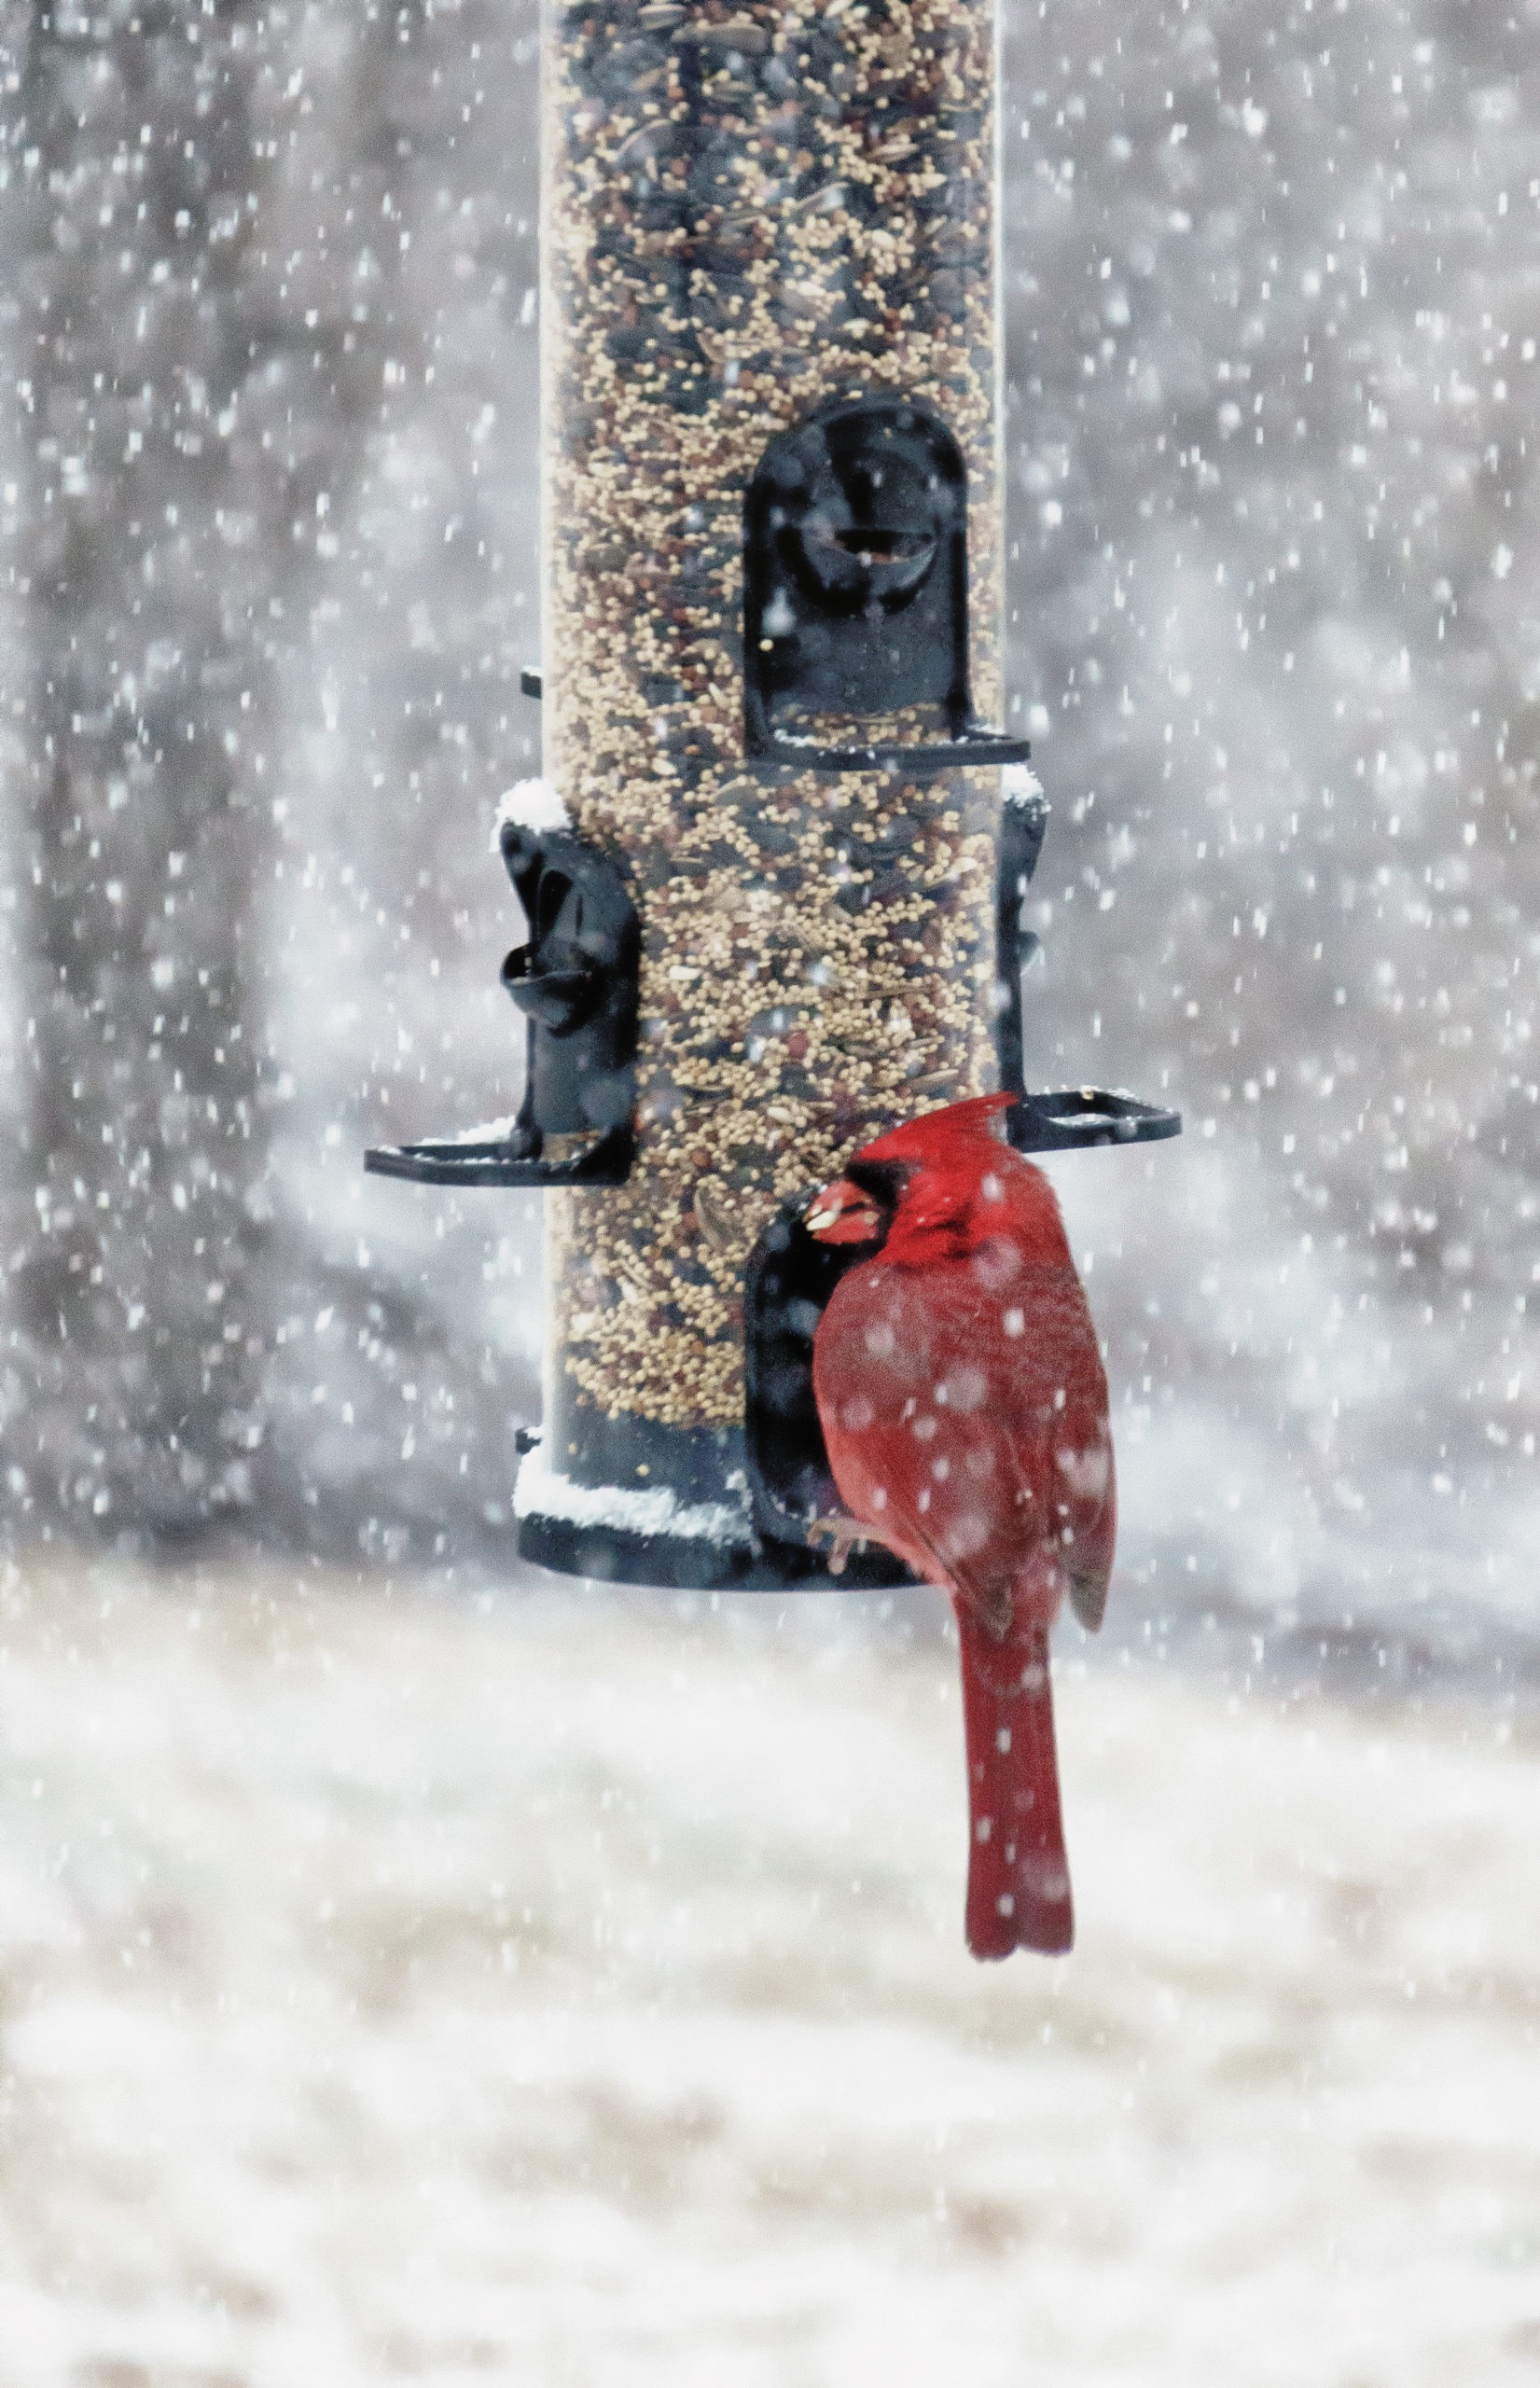
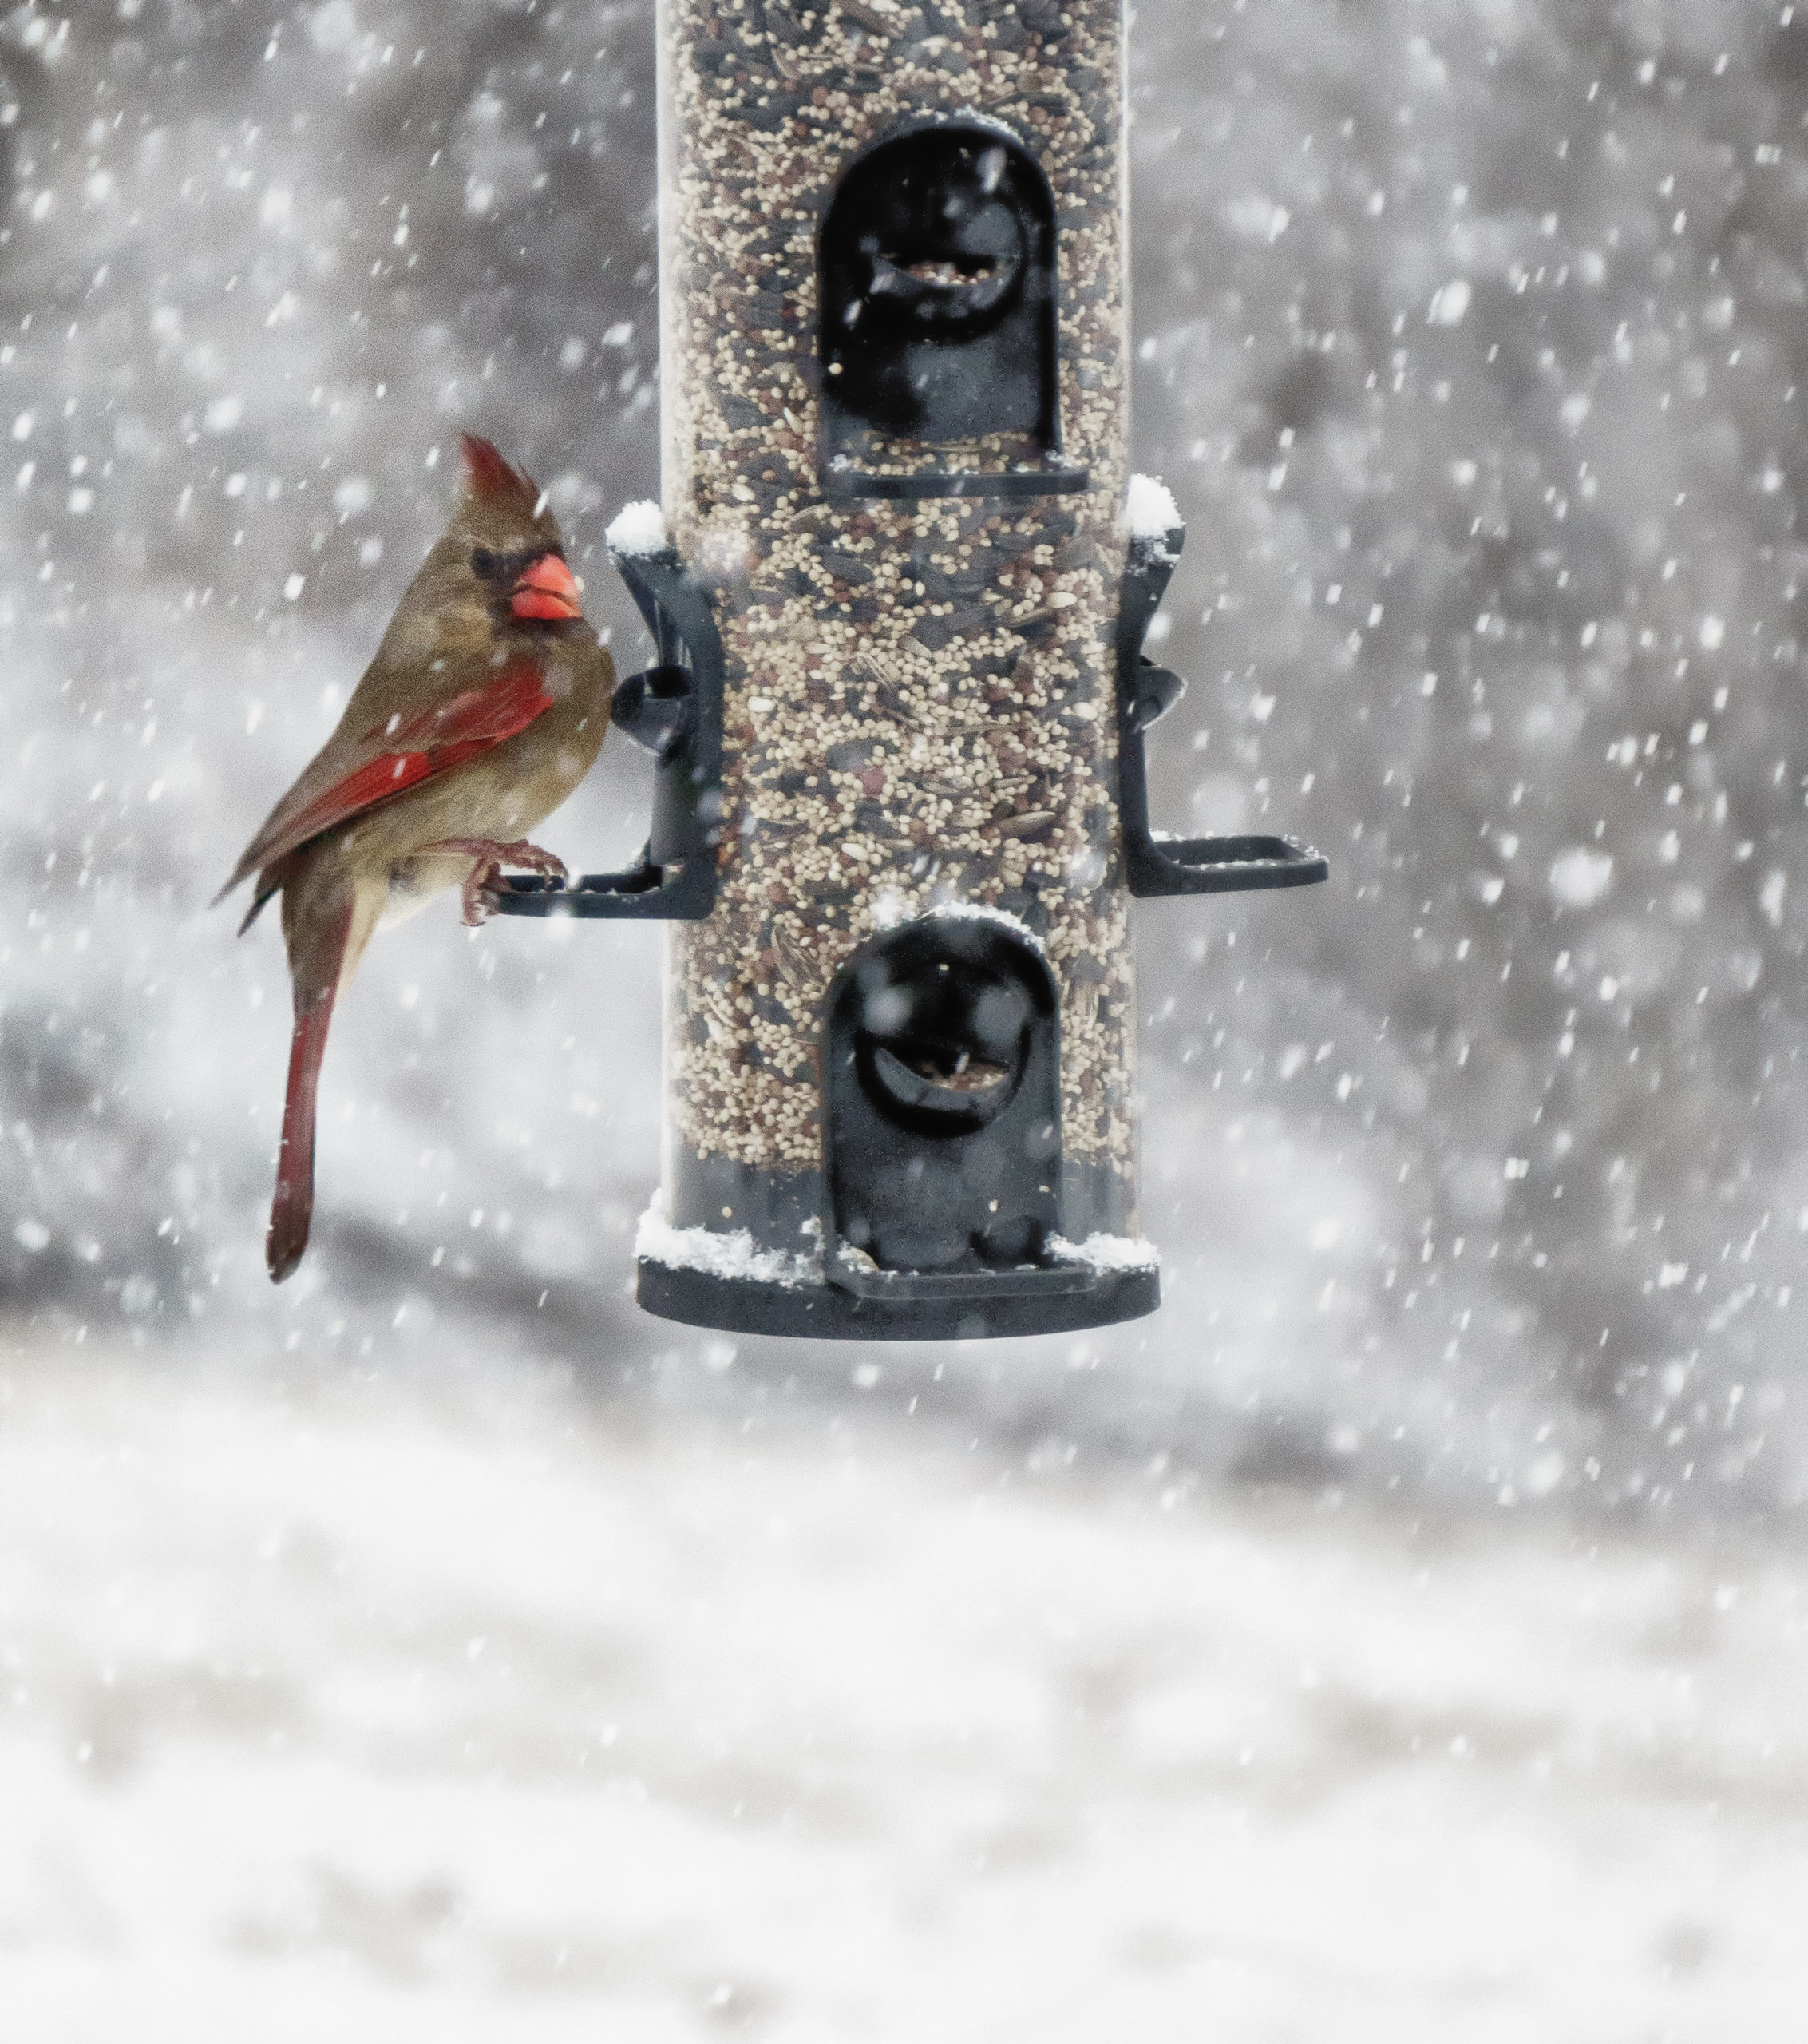
Live bird feeder in light snow
I don’t listen to Sondheim’s Assassins all that often, and man does it hit differently every time.
Got some pretty nice light out there, if the birds want to play along. Live bird feeder