I’ve been using Tweetnest to download and archive my tweets for some time now. I set it up some time ago, and generally, it just runs. I think I’ve had to go reboot the cronjob it uses to collect new tweets once or twice. I just added a feature to automate finding tweets “on this day” from prior years.
Background
Tweetnest, if you’re unfamiliar, is a self-hosted app to collect all your tweets and present them nicely in a way that’s separate from Twitter’s interface. It collects everything into a mySQL database, and is written in PHP. It’s nice to have a backup of Tweets kept separate from Twitter.
The main page just displays recent tweets, but it also lets you search, and has month and day pages. It’s a nice, calm interface for exploring or searching old Tweets of yours, which comes in more handy than you’d think.
I have been using Micro.blog more, through this site, which solves some of those problems. But even if I left Twitter today, having this backup and nice interface to it would be valuable, so I figured it was worth doing a little writeup on.
Ok, so what’s the new feature?
As I said I haven’t really touched the site since installing it, and mostly it works fine. But I recently went in a made a tweak, which is the impetus for this post.
One thing I’ve been doing recently is checking out my Tweets “on this day” to see what was going on last year, five years ago, even a decade ago. Twitter doesn’t have a function for this natively, and neither does Tweetnest.
I started out just by visiting the pages on Tweetnest sequentially. The daily page URLs are formatted year/month/day, so you can visit last year’s pretty easily, then just change the year in the URL, see the new ones, and so on. But this is tedious and occasionally there are no Tweets on a given day so it’s a waste of time.
I quickly tired of that, and wrote a little Keyboard Maestro macro to get the current date, format the URL properly, and open tabs in my browser, one for each year between one year ago and when my archive starts in 2008. This is pretty good, but it only works on desktop, not mobile, and it still suffers from the case when there are no tweets on a day (it just opens a tab that says “No tweets here!”).
Finally, I decided to create a proper solution. I built a page for the site that gets the current day and month, then queries the database for tweets that happened today, and presents them.
The code
This was pretty simple and required no innovation on my part. I just modified the code for a specific day to remove the year, and added logic to get the date from the current date, instead of the URL. It’s functional, but since I don’t know PHP it’s quite possible I’ve done something wrong. Here’s the query:
date_default_timezone_set('America/Chicago');
$day = date("d");
$month = date("m");

...

query("SELECT `".DTP."tweets`.*, `".DTP."tweetusers`.`screenname`, `".DTP."tweetusers`.`realname`, `".DTP."tweetusers`.`profileimage` FROM `".DTP."tweets` LEFT JOIN `".DTP."tweetusers` ON `".DTP."tweets`.`userid` = `".DTP."tweetusers`.`userid` WHERE MONTH(FROM_UNIXTIME(`time`" . DB_OFFSET . ")) = '" . s($month) . "' AND DAY(FROM_UNIXTIME(`time`" . DB_OFFSET . ")) = '" . s($day) . "' AND `".DTP."tweets`.`hidden` = 0 ORDER BY `".DTP."tweets`.`time` DESC");<br>
Next, I modified the .htaccess file to run the new php file at a particular URL (I called mine “/today”), and the inc/html.php file to include a link to “/today” in the sidebar. And that’s that. Now I can visit that link and see all the tweets posted through the years on a single page. You can see my modifications on my Github fork of the project.
Other enhancements
One other thing about Tweetnest is that it hasn’t been officially updated to include the new, longer Tweets. So some folks who use it have modified it to take advantage of those. You can see those changes in my previous commit, or in various issues in the main repository.
One shortcoming
A thing I noticed while working on this was that, because I hadn’t made the long-tweets upgrade until now, many prior tweets are truncated (Twitter increased the length at the end of 2017).
One suggestion in the Github issues was to remove all tweets since the lengthening and re-import them.
Tweetnest has two ways of importing tweets: The loadtweets.php file and the loadarchive.php file.
Loadtweets is the thing that runs on a cronjob, so usually it’s only grabbing a handful of tweets at a time. It uses Twitter’s API to get tweets, and so is limited to 3,200. This, unfortunately, isn’t quite far enough to get all my Tweets since the change (it also hits a memory error when trying to load that many).
Loadarchive was built to consume json files you can download from Twitter that contain your archive. Twitter limits public access to tweets to the last 3,200, but it will compile your data and let you download all of your tweets.
Unfortunately, the format of this archive has changed since this function was written for Tweetnest. I attempted this route, but ran into a couple roadblocks:
The link to the tweet on Twitter is missing its username. Tweetnest generates the Tweet, but wherever it’s trying to grab the username from to generate the link is missing, and so the URL it links to is just missing a piece.
Retweets are messed up. In prior archives (and in current API calls) you seem to get much more information about retweets than you do in the archive. And so when you load tweets from the archive, Retweets aren’t able to get the original tweet.
There are probably ways around both of these problems for someone more versed in PHP and/or Twitter’s API/data than I am, but since new tweets should come in at their full length and new retweets are ok, it’s not vital to fix these problems. (If you do tackle this, please let me know).
Conclusion
Tweetnest is pretty great, especially for some free software written nearly a decade ago. It’s nice to be able to hack on things and add features that make your life slightly easier.
I’ve a had a few Raspberry Pi Zeros lying around projectless for a while now — they’re just so inexpensive and I love the idea of a tiny cheap computer, so every time there’s a new revision I pick one up at Microcenter. I have an original 1.2, a 1.3 (with the added camera connector) and a Pi Zero W with integrated wireless and bluetooth.
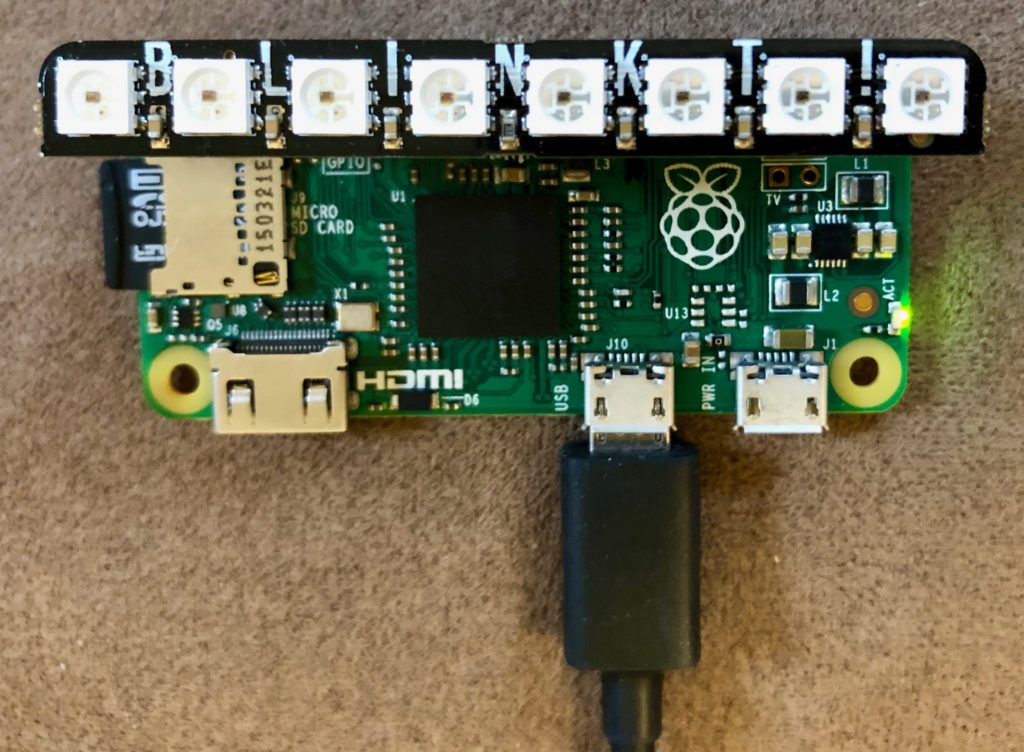
Back when I first started fiddling with the Pis, I bought a few RGB LEDs, but couldn’t get them working right. I’m sure it was a combo of not having the appropriate resistors and user incompetence. I was in Microcenter the other day, and while they did not have a new Pi, they did have a Pimoroni Blinkt: Pre-soldered headers, and 8 individually addressable RGB LEDs with a Python library.
The Blinkt actually fits within the footprint of the Pi — it only looks like it’s overhanging on the sides here because it’s sitting up very high. I have a female header on the Pi and the Blinkt comes with a female header, so there’s a connector in between, making the whole thing about 3/4″ higher than the surface of the Pi.
After plugging it in 1, I installed the library to the Pi. It comes with a bunch of examples to get you started. It’s super-easy to light up a pixel: set_pixel(pixel,r_value,g_value,b_value) for whichever pixels you want to set or update, then show() to send the command 2.
Then I had to decide what to build. I’m not too interested in notification things, like new messages on Twitter or Facebook or new emails or whatever. Those are pretty much on or off, and additionally would require tying into multiple services.
Weather seemed interesting. I’d looked at the Dark Sky API before. There’s a lot of complexity there: Temperature, precipitation, wind, humidity, visibility, clouds, etc. plus looking at current conditions, future conditions, or even past conditions.
Design
Eight LEDs isn’t that many. I wanted to build a status-board type app — no user input (aside from location). But I also wanted to do more than just display current conditions.
I settled on having a number of “screens” the app would cycle through, each displaying a different type of information. I only make use of a max of seven LEDs per screen, leaving one to indicate which screen you’re currently viewing.
(So far) the screens I have are:
Current conditions — displays current temp, low and high in the next 24 hours, and precipitation probability for the current day.
Seven-day low-temperature forecast
Seven-day high-temperature forecast
Seven-day precipitation probability forecast
The display cycles between each screen on a two-second delay. It updates its data from the Dark Sky API every five minutes (probably overkill, but the API gives you 1,000 calls per day for free).
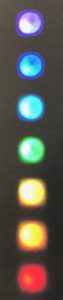
For the temperature displays, I have a scale of < 0° (purple), 0-32° (blue), 32-50° (light blue), 50-65° (green), 65-80° (yellow), 80-95° (orange) and > 95° (red). I’ve also decided to use apparent temperature rather than actual in all cases. Example at left.
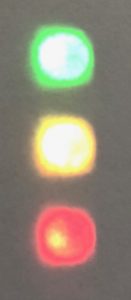
For the precipitation, I have < 25% chance (green), 25-75% chance (yellow) and > 75% chance (red). Example at right.
The indicator letting you know you’re looking at current conditions is white, seven-day low temp is blue, seven-day high temp is red, and seven-day precipitation is green. Given the need to clearly indicate which screen you’re on, I’m not sure how many more I’d be able to add without being confusing.
Demo
Unfortunately our weather here in St. Louis isn’t terribly variable at the moment, but here’s a walkthrough of the current displays nonetheless. These are all diffused through an index card as it’s difficult to take a photo of the LEDs directly. The display just cycles through the following four screens.
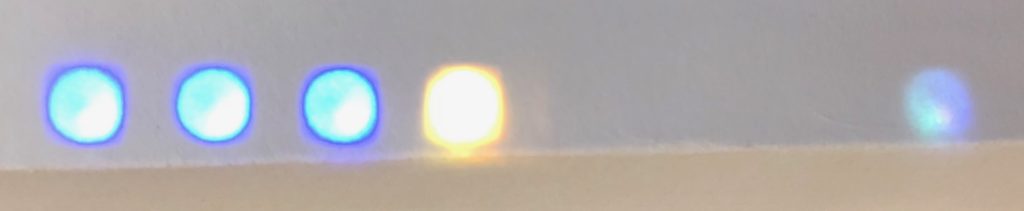
Current Conditions
The current conditions are: Current temp, 24-hour low and 24-hour high all between 0 and 32°F, and a 25-75% chance of precipitation today. You can see the status indicator light at the far right (it’s white, though it looks blueish in the image).
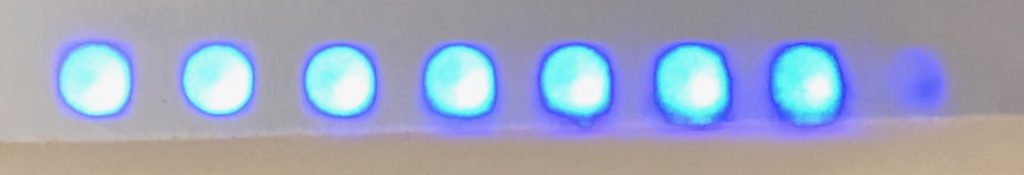
7-day low temperatures
Pretty simple to read this one: 0-32°F lows all week. Blue status indicator.
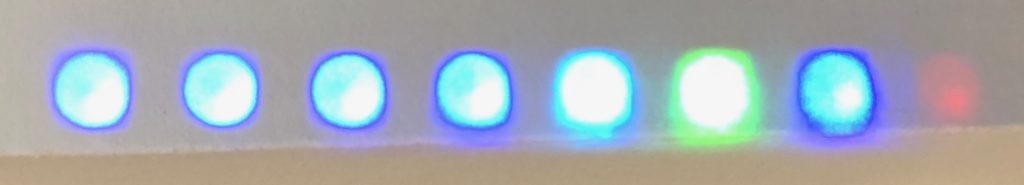
7-day high temperatures
Hey, something different! On Thursday, the high temp will be between 32 and 50°F, and on Friday it will be between 50 and 65°F. Red status indicator.
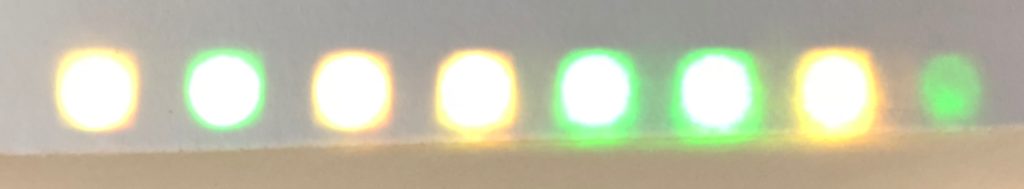
7-day precipitation
Here’s the 7-day precipitation forecast. 25-75% chance of precipitation today, Tuesday, Wednesday and Saturday. Less than 25% chance Monday, Thursday and Friday. Green indicator.
How it works
Here’s the whole program:
import json, time, os.path
import blinkt, requests

status_colors = {'current':[1,1,1],'high':[1,0,0],'low':[0,0,1],'precip':[0,1,0]}

blinkt.set_clear_on_exit()
blinkt.set_brightness(.1)

def getForecast(key,lat,lng):
url = 'https://api.darksky.net/forecast/' + key + '/' + str(lat) + ',' + str(lng)

stl = requests.get(url)

return stl.json()

def getTempColor(temp):
if temp <= 0:
color = [10,0,30]
elif temp <= 32:
color = [0,0,30]
elif temp <= 50:
color = [0,15,30]
elif temp <= 65:
color = [0,30,0]
elif temp <= 80:
color = [60,20,0]
elif temp <= 95:
color = [60,10,0]
else:
color = [30,0,0]
return color

def getStoplightColor(prob,low,high):
if prob < low:
color = [0,30,0]
elif prob < high:
color = [60,20,0]
else:
color = [30,0,0]
return color

def showSevenDayTemps(temps, which):
blinkt.clear()
# set status light
color = status_colors[which]
blinkt.set_pixel(7,color[0],color[1],color[2])
for i in range(7):
color = getTempColor(temps[i])
blinkt.set_pixel(i,color[0],color[1],color[2])
blinkt.show()

def showSevenDayPrecip(precip, which):
blinkt.clear()
# set status light
color = status_colors[which]
blinkt.set_pixel(7,color[0],color[1],color[2])
for i in range(7):
color = getStoplightColor(precip[i],.25,.75)
blinkt.set_pixel(i,color[0],color[1],color[2])
blinkt.show()

def showCurrent(data):
blinkt.clear()
# set status light
color = status_colors['current']
blinkt.set_pixel(7,color[0],color[1],color[2])
# get current temp (use color scale)
color = getTempColor(data['temp'])
blinkt.set_pixel(0,color[0],color[1],color[2])
# daily high and low (use color scale)
color = getTempColor(data['low'])
blinkt.set_pixel(1,color[0],color[1],color[2])
color = getTempColor(data['high'])
blinkt.set_pixel(2,color[0],color[1],color[2])
# precip (red, yellow, green)
color = getStoplightColor(data['precip'],.25,.75)
blinkt.set_pixel(3,color[0],color[1],color[2])

blinkt.show()

def prepData(forecast):

data = {'lows': [], 'highs': [], 'precip': [], 'current': {}}

for day in forecast['daily']['data']:
data['lows'].append(day['apparentTemperatureLow'])
data['highs'].append(day['apparentTemperatureHigh'])
data['precip'].append(day['precipProbability'])

curr_temp = forecast['currently']['apparentTemperature']
data['current']['temp'] = curr_temp
data['current']['low'] = curr_temp
data['current']['high'] = curr_temp

for hour in forecast['hourly']['data'][:24]:
if hour['apparentTemperature'] < data['current']['low']: data['current']['low'] = hour['apparentTemperature'] if hour['apparentTemperature'] > data['current']['high']:
data['current']['high'] = hour['apparentTemperature']

data['current']['precip'] = forecast['daily']['data'][0]['precipProbability']

return data

forecast = None
cur_time = time.time()
interval = 5*60
delay = 2

while True:
if forecast is not None and (cur_time + interval) > time.time():
pass
else:
forecast = getForecast( [api key] ,38.6270,-90.1994)
data = prepData(forecast)
cur_time = time.time()

showCurrent(data['current'])
time.sleep(delay)
showSevenDayTemps(data['lows'], 'low')
time.sleep(delay)
showSevenDayTemps(data['highs'], 'high')
time.sleep(delay)
showSevenDayPrecip(data['precip'], 'precip')
time.sleep(delay)
First, we’re importing the necessary packages, including blinkt to control the LEDs and requests to access the API. The status_colors variable is a dict of the screens and their associated indicator colors. The next two functions tell the script to clear out all the lights when the program exits, and to set the default brightness of the LEDs to the minimum (you can control the brightness individually when you set the pixel, though anything more than the minimum is very bright.
interval and delay are about timing, but different things. interval determines how long to wait before getting a new update from the API. As written, the program makes a new call every five minutes. The Pi Zero doesn’t have a real time clock, so if I need the actual time I have to sync it from the Internet somewhere. But I realized I don’t actually need to know real time, only elapsed time. So I get whatever time the Pi thinks it is when the program starts (cur_time = time.time()) and then just check how much time has elapsed to see if I need an update from the API.
delay determines how long to pause on each screen. Right now it’s set at two seconds, which is probably as quick as I’d want it to be. A touch slower might be better.
Next is a loop that runs continuously while the program is running.
while True:
if forecast is not None and (cur_time + interval) > time.time():
pass
else:
forecast = getForecast( [API key here] ,38.6270,-90.1994)
data = prepData(forecast)
cur_time = time.time()
First I have to determine whether or not to hit the API for a new forecast. I need to get a new forecast whenever I either don’t have one at all (e.g. the user has just started the program) or if it’s out of date. So the first condition (line 112) just says if both of those conditions are false, I don’t need a new one.
If I do need a new one, I go get it (getForecast()), passing in my API key, and the lat/lng of the location. One enhancement might be asking the user for a lat/lng on run, or even a city/state or ZIP and geolocating. Here’s the getForecast() function:
Pretty straightforward. The API has a few optional parameters, but a basic call like this gets everything. The function returns the json response.
After I’ve got the data, I do a little prep to make it easier to work with. That’s prepData() on line 116. Here it is:
def prepData(forecast):

data = {'lows': [], 'highs': [], 'precip': [], 'current': {}}

for day in forecast['daily']['data']:
data['lows'].append(day['apparentTemperatureLow'])
data['highs'].append(day['apparentTemperatureHigh'])
data['precip'].append(day['precipProbability'])

curr_temp = forecast['currently']['apparentTemperature']
data['current']['temp'] = curr_temp
data['current']['low'] = curr_temp
data['current']['high'] = curr_temp

for hour in forecast['hourly']['data'][:24]:
if hour['apparentTemperature'] < data['current']['low']: data['current']['low'] = hour['apparentTemperature'] if hour['apparentTemperature'] > data['current']['high']:
data['current']['high'] = hour['apparentTemperature']

data['current']['precip'] = forecast['daily']['data'][0]['precipProbability']

return data
This takes the entire forecast returned by the API and whittles it down into just the datapoints that I need. First I create a dict with no data in it to clear out any existing data. Next I get the seven-day forecasts for low, high and precipitation, creating a list for each measurement. Finally I work on the current conditions. I decided to display the current temperature, the low and high for the next 24 hours and the current day’s precipitation probability. So I set all three values equal to the current temp, then loop through the first 24 hours and update the low or high value whenever I find one that’s lower or higher than the one already stored. I may decide to do the same thing with the precipitation probability. As it is now, the “current” screen just shows the current day’s chance of precipitation, which isn’t that useful at 10 p.m.
Then after I’ve updated the data from the API and prepared the data, I update cur_time to the current system time (line 117), so I won’t check the API again until the interval has passed.
I have three functions called four times, each one followed by a delay. The first screen shows current conditions:
def showCurrent(data):
blinkt.clear()
# set status light
color = status_colors['current']
blinkt.set_pixel(7,color[0],color[1],color[2])
# get current temp (use color scale)
color = getTempColor(data['temp'])
blinkt.set_pixel(0,color[0],color[1],color[2])
# daily high and low (use color scale)
color = getTempColor(data['low'])
blinkt.set_pixel(1,color[0],color[1],color[2])
color = getTempColor(data['high'])
blinkt.set_pixel(2,color[0],color[1],color[2])
# precip (red, yellow, green)
color = getStoplightColor(data['precip'],.25,.75)
blinkt.set_pixel(3,color[0],color[1],color[2])

blinkt.show()
blinkt.clear() is part of the blinkt library that sets all the pixels to nothing. This just ensures that nothing carries over from the other screens.
Next, I set the status indicator. This uses the status_colors dict to get the color, and blinkt.set_pixel() to set the last pixel to the color (in this case, white).
The first three pixels indicate current temperature, 24-hour low and 24-hour high, respectively. I wrote a getTempColor() function to return the appropriate color. Here it is:
def getTempColor(temp):
if temp <= 0:
color = [10,0,30]
elif temp <= 32:
color = [0,0,30]
elif temp <= 50:
color = [0,15,30]
elif temp <= 65:
color = [0,30,0]
elif temp <= 80:
color = [60,20,0]
elif temp <= 95:
color = [60,10,0]
else:
color = [30,0,0]
return color
It just takes a temperature and figures out which bucket it falls into, returning the appropriate color. I chose the breakpoints somewhat arbitrarily. I knew I didn’t want to have too many colors to distinguish between, so that limited the number of buckets. The buckets and colors are:
Really really cold (< 0°F) — purple
Below freezing — dark blue
Cold — light blue
A little chilly — green
Nice — yellow
A little warm — orange
Really hot – red
The fourth pixel on the current screen gives the precipitation probability. I wrote a getStoplightColor() function to take a probability and two thresholds and return a stoplight value. Here’s that one:
def getStoplightColor(prob,low,high):
if prob < low:
color = [0,30,0]
elif prob < high:
color = [60,20,0]
else:
color = [30,0,0]
return color
Pretty simple there. For precipitation, I decided to go with buckets of less than 25%, 25-75% and greater than 75%, showing green, yellow and red respectively.
I’m only using four pixels, plus the status indicator on the current screen. Once I have those all set, all that’s left is to call blinkt.show() to update the display.
The next two screens are the seven-day low and seven-day high temperature forecasts. Those both use the same function, showSevenDayTemps(), which takes the data and which value it is (high or low). Here’s that function:
def showSevenDayTemps(temps, which):
blinkt.clear()
# set status light
color = status_colors[which]
blinkt.set_pixel(7,color[0],color[1],color[2])
for i in range(7):
color = getTempColor(temps[i])
blinkt.set_pixel(i,color[0],color[1],color[2])
blinkt.show()
Again I clear the pixels of their previous values and set the status pixel. Next is simply stepping through the list of temperatures, getting the correct color with getTempColor() and setting the pixel. After I’ve done all that, I call blinkt.show() to update the display.
And finally, we have the seven-day precipitation forecast, with showSevenDayPrecip():
def showSevenDayPrecip(precip, which):
blinkt.clear()
# set status light
color = status_colors[which]
blinkt.set_pixel(7,color[0],color[1],color[2])
for i in range(7):
color = getStoplightColor(precip[i],.25,.75)
blinkt.set_pixel(i,color[0],color[1],color[2])
blinkt.show()
This is almost identical to the temps function, except it calls getStoplightColor() instead.
And that’s it — the program just cycles through that while True loop, updating the data from the API as necessary.
Overall, the Blinkt is really easy to work with, mostly due to the library it ships with and the fact that there are only 8 LEDs to manage. It can be tricky to get the LEDs to display the color you’re looking for — adjusting yellow to be distinguishable from orange, for example. The brightness is also tricky to manage — brighter colors are easier to differentiate, but a white pixel at full brightness is painful to look at unless you’re using a diffuser of some kind. If you want to mount this permanently with a diffuser, you’d probably want to modify the code to account for it.
Some other stuff I’ve thought of that might be useful to add:
Ask user for location at runtime
Screen depicting image of current weather (e.g. oriented vertically, a clear day would be one bright yellow pixel for the sun, several bright blue pixels for the sky, and one green pixel for the ground). Could perhaps even animate between screens to show progress over a day or something
Blinking current precipitation indicator to show it’s happening now or soon, rather than just probability
Blinking alert indicator to show any weather alerts
Moon phase indicator
Cloud cover indicator
Start script automatically on boot to allow running without computer connection (would need Wi-Fi adapter, and automatic internet connection)
In conclusion: It’s a fun project with lots of opportunities to continue hacking on.
I had already soldered some headers onto one of my Pis, but unfortunately I couldn’t get the Blinkt working. It did work on another Pi, so I figured it was my soldering job. I de-soldered and re-soldered the headers from the Pi and it works now. ↩
There are also commands to clear out all the pixels, set them all to be the same, and change the brightness of all pixels at once, among others. ↩