“The readers of the Manhattan Argus aren’t interested in sensationalism, gossip and unsupported speculation! Facts, figures charts — those are the tools of the newspaper trade!” RIP John Mahoney
Raspberry Pi + Blinkt = Weather status
I made a thing!
I’ve a had a few Raspberry Pi Zeros lying around projectless for a while now — they’re just so inexpensive and I love the idea of a tiny cheap computer, so every time there’s a new revision I pick one up at Microcenter. I have an original 1.2, a 1.3 (with the added camera connector) and a Pi Zero W with integrated wireless and bluetooth.
Back when I first started fiddling with the Pis, I bought a few RGB LEDs, but couldn’t get them working right. I’m sure it was a combo of not having the appropriate resistors and user incompetence. I was in Microcenter the other day, and while they did not have a new Pi, they did have a Pimoroni Blinkt: Pre-soldered headers, and 8 individually addressable RGB LEDs with a Python library.
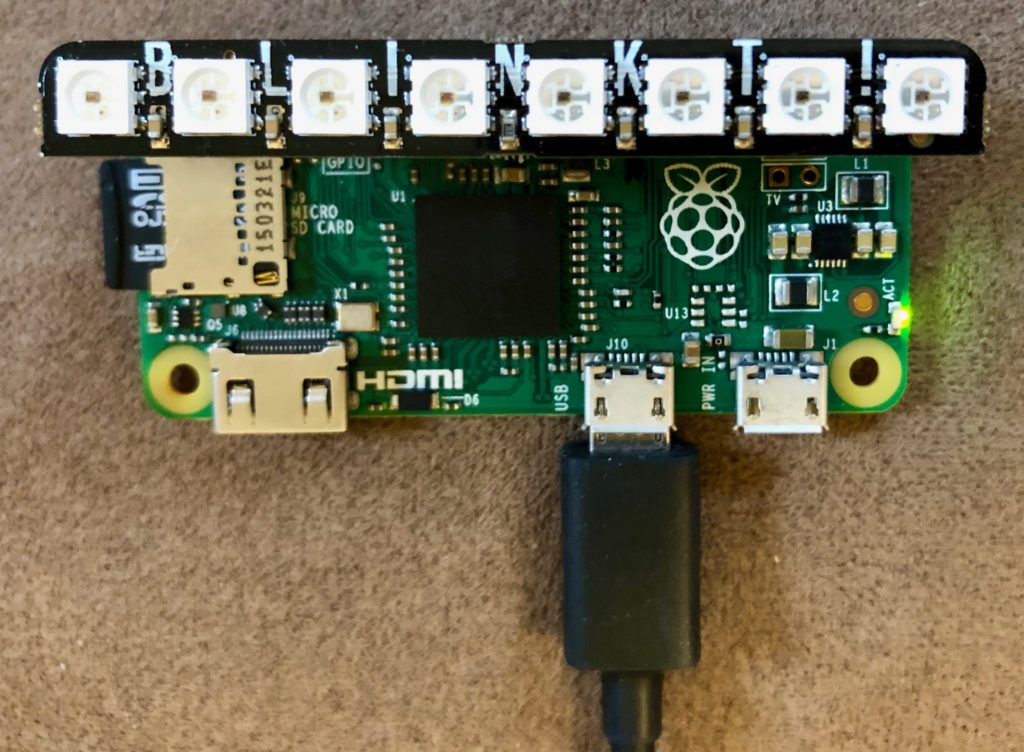
After plugging it in 1, I installed the library to the Pi. It comes with a bunch of examples to get you started. It’s super-easy to light up a pixel: set_pixel(pixel,r_value,g_value,b_value) for whichever pixels you want to set or update, then show() to send the command 2.
Then I had to decide what to build. I’m not too interested in notification things, like new messages on Twitter or Facebook or new emails or whatever. Those are pretty much on or off, and additionally would require tying into multiple services.
Weather seemed interesting. I’d looked at the Dark Sky API before. There’s a lot of complexity there: Temperature, precipitation, wind, humidity, visibility, clouds, etc. plus looking at current conditions, future conditions, or even past conditions.
Design
Eight LEDs isn’t that many. I wanted to build a status-board type app — no user input (aside from location). But I also wanted to do more than just display current conditions.
I settled on having a number of “screens” the app would cycle through, each displaying a different type of information. I only make use of a max of seven LEDs per screen, leaving one to indicate which screen you’re currently viewing.
(So far) the screens I have are:
- Current conditions — displays current temp, low and high in the next 24 hours, and precipitation probability for the current day.
- Seven-day low-temperature forecast
- Seven-day high-temperature forecast
- Seven-day precipitation probability forecast
The display cycles between each screen on a two-second delay. It updates its data from the Dark Sky API every five minutes (probably overkill, but the API gives you 1,000 calls per day for free).
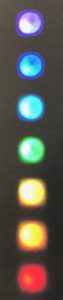
For the temperature displays, I have a scale of < 0° (purple), 0-32° (blue), 32-50° (light blue), 50-65° (green), 65-80° (yellow), 80-95° (orange) and > 95° (red). I’ve also decided to use apparent temperature rather than actual in all cases. Example at left.
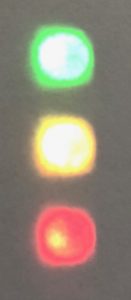
For the precipitation, I have < 25% chance (green), 25-75% chance (yellow) and > 75% chance (red). Example at right.
The indicator letting you know you’re looking at current conditions is white, seven-day low temp is blue, seven-day high temp is red, and seven-day precipitation is green. Given the need to clearly indicate which screen you’re on, I’m not sure how many more I’d be able to add without being confusing.
Demo
Unfortunately our weather here in St. Louis isn’t terribly variable at the moment, but here’s a walkthrough of the current displays nonetheless. These are all diffused through an index card as it’s difficult to take a photo of the LEDs directly. The display just cycles through the following four screens.
Current Conditions
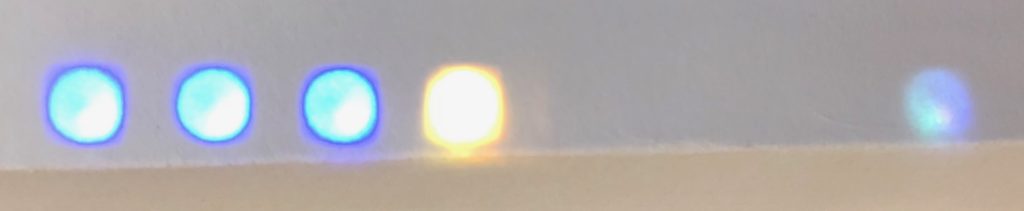
The current conditions are: Current temp, 24-hour low and 24-hour high all between 0 and 32°F, and a 25-75% chance of precipitation today. You can see the status indicator light at the far right (it’s white, though it looks blueish in the image).
7-day low temperatures
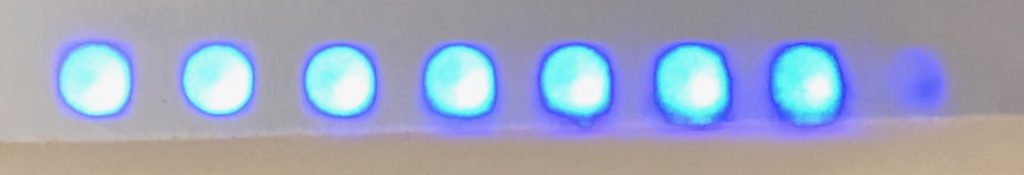
Pretty simple to read this one: 0-32°F lows all week. Blue status indicator.
7-day high temperatures
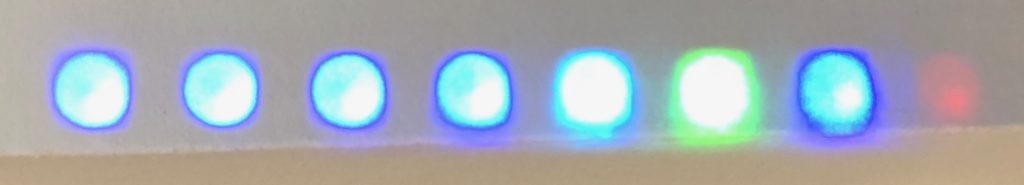
Hey, something different! On Thursday, the high temp will be between 32 and 50°F, and on Friday it will be between 50 and 65°F. Red status indicator.
7-day precipitation
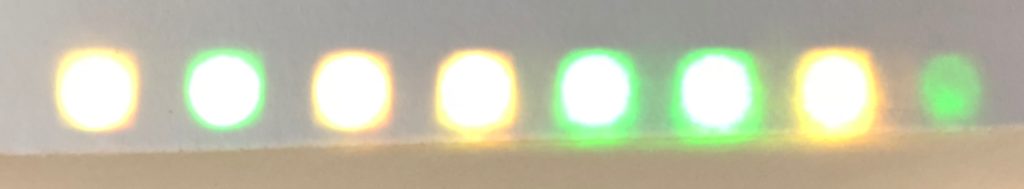
Here’s the 7-day precipitation forecast. 25-75% chance of precipitation today, Tuesday, Wednesday and Saturday. Less than 25% chance Monday, Thursday and Friday. Green indicator.
How it works
Here’s the whole program:
import json, time, os.path
import blinkt, requests

status_colors = {'current':[1,1,1],'high':[1,0,0],'low':[0,0,1],'precip':[0,1,0]}

blinkt.set_clear_on_exit()
blinkt.set_brightness(.1)

def getForecast(key,lat,lng):
url = 'https://api.darksky.net/forecast/' + key + '/' + str(lat) + ',' + str(lng)

stl = requests.get(url)

return stl.json()

def getTempColor(temp):
if temp <= 0:
color = [10,0,30]
elif temp <= 32:
color = [0,0,30]
elif temp <= 50:
color = [0,15,30]
elif temp <= 65:
color = [0,30,0]
elif temp <= 80:
color = [60,20,0]
elif temp <= 95:
color = [60,10,0]
else:
color = [30,0,0]
return color

def getStoplightColor(prob,low,high):
if prob < low:
color = [0,30,0]
elif prob < high:
color = [60,20,0]
else:
color = [30,0,0]
return color

def showSevenDayTemps(temps, which):
blinkt.clear()
# set status light
color = status_colors[which]
blinkt.set_pixel(7,color[0],color[1],color[2])
for i in range(7):
color = getTempColor(temps[i])
blinkt.set_pixel(i,color[0],color[1],color[2])
blinkt.show()

def showSevenDayPrecip(precip, which):
blinkt.clear()
# set status light
color = status_colors[which]
blinkt.set_pixel(7,color[0],color[1],color[2])
for i in range(7):
color = getStoplightColor(precip[i],.25,.75)
blinkt.set_pixel(i,color[0],color[1],color[2])
blinkt.show()

def showCurrent(data):
blinkt.clear()
# set status light
color = status_colors['current']
blinkt.set_pixel(7,color[0],color[1],color[2])
# get current temp (use color scale)
color = getTempColor(data['temp'])
blinkt.set_pixel(0,color[0],color[1],color[2])
# daily high and low (use color scale)
color = getTempColor(data['low'])
blinkt.set_pixel(1,color[0],color[1],color[2])
color = getTempColor(data['high'])
blinkt.set_pixel(2,color[0],color[1],color[2])
# precip (red, yellow, green)
color = getStoplightColor(data['precip'],.25,.75)
blinkt.set_pixel(3,color[0],color[1],color[2])

blinkt.show()

def prepData(forecast):

data = {'lows': [], 'highs': [], 'precip': [], 'current': {}}

for day in forecast['daily']['data']:
data['lows'].append(day['apparentTemperatureLow'])
data['highs'].append(day['apparentTemperatureHigh'])
data['precip'].append(day['precipProbability'])

curr_temp = forecast['currently']['apparentTemperature']
data['current']['temp'] = curr_temp
data['current']['low'] = curr_temp
data['current']['high'] = curr_temp

for hour in forecast['hourly']['data'][:24]:
if hour['apparentTemperature'] < data['current']['low']: data['current']['low'] = hour['apparentTemperature'] if hour['apparentTemperature'] > data['current']['high']:
data['current']['high'] = hour['apparentTemperature']

data['current']['precip'] = forecast['daily']['data'][0]['precipProbability']

return data

forecast = None
cur_time = time.time()
interval = 5*60
delay = 2

while True:
if forecast is not None and (cur_time + interval) > time.time():
pass
else:
forecast = getForecast( [api key] ,38.6270,-90.1994)
data = prepData(forecast)
cur_time = time.time()

showCurrent(data['current'])
time.sleep(delay)
showSevenDayTemps(data['lows'], 'low')
time.sleep(delay)
showSevenDayTemps(data['highs'], 'high')
time.sleep(delay)
showSevenDayPrecip(data['precip'], 'precip')
time.sleep(delay)
We’ll just go through it line by line:
import json, time, os.path
import blinkt, requests

status_colors = {'current':[1,1,1],'high':[1,0,0],'low':[0,0,1],'precip':[0,1,0]}

blinkt.set_clear_on_exit()
blinkt.set_brightness(.1)
First, we’re importing the necessary packages, including blinkt to control the LEDs and requests to access the API. The status_colors variable is a dict of the screens and their associated indicator colors. The next two functions tell the script to clear out all the lights when the program exits, and to set the default brightness of the LEDs to the minimum (you can control the brightness individually when you set the pixel, though anything more than the minimum is very bright.
Skipping down to the main program:
forecast = None
cur_time = time.time()
interval = 5*60
delay = 2
interval and delay are about timing, but different things. interval determines how long to wait before getting a new update from the API. As written, the program makes a new call every five minutes. The Pi Zero doesn’t have a real time clock, so if I need the actual time I have to sync it from the Internet somewhere. But I realized I don’t actually need to know real time, only elapsed time. So I get whatever time the Pi thinks it is when the program starts (cur_time = time.time()) and then just check how much time has elapsed to see if I need an update from the API.
delay determines how long to pause on each screen. Right now it’s set at two seconds, which is probably as quick as I’d want it to be. A touch slower might be better.
Next is a loop that runs continuously while the program is running.
while True:
if forecast is not None and (cur_time + interval) > time.time():
pass
else:
forecast = getForecast( [API key here] ,38.6270,-90.1994)
data = prepData(forecast)
cur_time = time.time()
First I have to determine whether or not to hit the API for a new forecast. I need to get a new forecast whenever I either don’t have one at all (e.g. the user has just started the program) or if it’s out of date. So the first condition (line 112) just says if both of those conditions are false, I don’t need a new one.
If I do need a new one, I go get it (getForecast()), passing in my API key, and the lat/lng of the location. One enhancement might be asking the user for a lat/lng on run, or even a city/state or ZIP and geolocating. Here’s the getForecast() function:
def getForecast(key,lat,lng):
url = 'https://api.darksky.net/forecast/' + key + '/' + str(lat) + ',' + str(lng)

stl = requests.get(url)

return stl.json()
Pretty straightforward. The API has a few optional parameters, but a basic call like this gets everything. The function returns the json response.
After I’ve got the data, I do a little prep to make it easier to work with. That’s prepData() on line 116. Here it is:
def prepData(forecast):

data = {'lows': [], 'highs': [], 'precip': [], 'current': {}}

for day in forecast['daily']['data']:
data['lows'].append(day['apparentTemperatureLow'])
data['highs'].append(day['apparentTemperatureHigh'])
data['precip'].append(day['precipProbability'])

curr_temp = forecast['currently']['apparentTemperature']
data['current']['temp'] = curr_temp
data['current']['low'] = curr_temp
data['current']['high'] = curr_temp

for hour in forecast['hourly']['data'][:24]:
if hour['apparentTemperature'] < data['current']['low']: data['current']['low'] = hour['apparentTemperature'] if hour['apparentTemperature'] > data['current']['high']:
data['current']['high'] = hour['apparentTemperature']

data['current']['precip'] = forecast['daily']['data'][0]['precipProbability']

return data
This takes the entire forecast returned by the API and whittles it down into just the datapoints that I need. First I create a dict with no data in it to clear out any existing data. Next I get the seven-day forecasts for low, high and precipitation, creating a list for each measurement. Finally I work on the current conditions. I decided to display the current temperature, the low and high for the next 24 hours and the current day’s precipitation probability. So I set all three values equal to the current temp, then loop through the first 24 hours and update the low or high value whenever I find one that’s lower or higher than the one already stored. I may decide to do the same thing with the precipitation probability. As it is now, the “current” screen just shows the current day’s chance of precipitation, which isn’t that useful at 10 p.m.
Then after I’ve updated the data from the API and prepared the data, I update cur_time to the current system time (line 117), so I won’t check the API again until the interval has passed.
Now, on to displaying the data!
showCurrent(data['current'])
time.sleep(delay)
showSevenDayTemps(data['lows'], 'low')
time.sleep(delay)
showSevenDayTemps(data['highs'], 'high')
time.sleep(delay)
showSevenDayPrecip(data['precip'], 'precip')
time.sleep(delay)
(this is all still in the while True loop)
I have three functions called four times, each one followed by a delay. The first screen shows current conditions:
def showCurrent(data):
blinkt.clear()
# set status light
color = status_colors['current']
blinkt.set_pixel(7,color[0],color[1],color[2])
# get current temp (use color scale)
color = getTempColor(data['temp'])
blinkt.set_pixel(0,color[0],color[1],color[2])
# daily high and low (use color scale)
color = getTempColor(data['low'])
blinkt.set_pixel(1,color[0],color[1],color[2])
color = getTempColor(data['high'])
blinkt.set_pixel(2,color[0],color[1],color[2])
# precip (red, yellow, green)
color = getStoplightColor(data['precip'],.25,.75)
blinkt.set_pixel(3,color[0],color[1],color[2])

blinkt.show()
blinkt.clear() is part of the blinkt library that sets all the pixels to nothing. This just ensures that nothing carries over from the other screens.
Next, I set the status indicator. This uses the status_colors dict to get the color, and blinkt.set_pixel() to set the last pixel to the color (in this case, white).
The first three pixels indicate current temperature, 24-hour low and 24-hour high, respectively. I wrote a getTempColor() function to return the appropriate color. Here it is:
def getTempColor(temp):
if temp <= 0:
color = [10,0,30]
elif temp <= 32:
color = [0,0,30]
elif temp <= 50:
color = [0,15,30]
elif temp <= 65:
color = [0,30,0]
elif temp <= 80:
color = [60,20,0]
elif temp <= 95:
color = [60,10,0]
else:
color = [30,0,0]
return color
It just takes a temperature and figures out which bucket it falls into, returning the appropriate color. I chose the breakpoints somewhat arbitrarily. I knew I didn’t want to have too many colors to distinguish between, so that limited the number of buckets. The buckets and colors are:
- Really really cold (< 0°F) — purple
- Below freezing — dark blue
- Cold — light blue
- A little chilly — green
- Nice — yellow
- A little warm — orange
- Really hot – red
The fourth pixel on the current screen gives the precipitation probability. I wrote a getStoplightColor() function to take a probability and two thresholds and return a stoplight value. Here’s that one:
def getStoplightColor(prob,low,high):
if prob < low:
color = [0,30,0]
elif prob < high:
color = [60,20,0]
else:
color = [30,0,0]
return color
Pretty simple there. For precipitation, I decided to go with buckets of less than 25%, 25-75% and greater than 75%, showing green, yellow and red respectively.
I’m only using four pixels, plus the status indicator on the current screen. Once I have those all set, all that’s left is to call blinkt.show() to update the display.
The next two screens are the seven-day low and seven-day high temperature forecasts. Those both use the same function, showSevenDayTemps(), which takes the data and which value it is (high or low). Here’s that function:
def showSevenDayTemps(temps, which):
blinkt.clear()
# set status light
color = status_colors[which]
blinkt.set_pixel(7,color[0],color[1],color[2])
for i in range(7):
color = getTempColor(temps[i])
blinkt.set_pixel(i,color[0],color[1],color[2])
blinkt.show()
Again I clear the pixels of their previous values and set the status pixel. Next is simply stepping through the list of temperatures, getting the correct color with getTempColor() and setting the pixel. After I’ve done all that, I call blinkt.show() to update the display.
And finally, we have the seven-day precipitation forecast, with showSevenDayPrecip():
def showSevenDayPrecip(precip, which):
blinkt.clear()
# set status light
color = status_colors[which]
blinkt.set_pixel(7,color[0],color[1],color[2])
for i in range(7):
color = getStoplightColor(precip[i],.25,.75)
blinkt.set_pixel(i,color[0],color[1],color[2])
blinkt.show()
This is almost identical to the temps function, except it calls getStoplightColor() instead.
And that’s it — the program just cycles through that while True loop, updating the data from the API as necessary.
Conclusions and future
The full code is available at this Gist.
Overall, the Blinkt is really easy to work with, mostly due to the library it ships with and the fact that there are only 8 LEDs to manage. It can be tricky to get the LEDs to display the color you’re looking for — adjusting yellow to be distinguishable from orange, for example. The brightness is also tricky to manage — brighter colors are easier to differentiate, but a white pixel at full brightness is painful to look at unless you’re using a diffuser of some kind. If you want to mount this permanently with a diffuser, you’d probably want to modify the code to account for it.
Some other stuff I’ve thought of that might be useful to add:
- Ask user for location at runtime
- Screen depicting image of current weather (e.g. oriented vertically, a clear day would be one bright yellow pixel for the sun, several bright blue pixels for the sky, and one green pixel for the ground). Could perhaps even animate between screens to show progress over a day or something
- Blinking current precipitation indicator to show it’s happening now or soon, rather than just probability
- Blinking alert indicator to show any weather alerts
- Moon phase indicator
- Cloud cover indicator
- Start script automatically on boot to allow running without computer connection (would need Wi-Fi adapter, and automatic internet connection)
In conclusion: It’s a fun project with lots of opportunities to continue hacking on.
- I had already soldered some headers onto one of my Pis, but unfortunately I couldn’t get the Blinkt working. It did work on another Pi, so I figured it was my soldering job. I de-soldered and re-soldered the headers from the Pi and it works now. ↩
- There are also commands to clear out all the pixels, set them all to be the same, and change the brightness of all pixels at once, among others. ↩
I’m happy “A Serious Man” is finally on Netflix even if it is just as inscrutable today as it was when I saw it in the theater nearly a decade ago.
Scotch & Soda
Starting off 2018 right. #slinger

2017 in review
I haven’t really done one of these before, so here goes.
Personally
The biggest news was finding out we’re having a second kid. That should happen within a month, so we’ve been anticipating it most of the year. Decided this time around to not find out if it’s a boy or girl, thus doubling the difficulty of choosing a name.
The current kid grows up more and more each week (as happens, I suppose). One of the most surprising things was when he began singing more: On the way home from school one day he knocked out a pretty good rendition of the National Anthem, and toward the end of the year he started singing a handful of Christmas carols including about three verses of Deck the Halls as well as more words of Feliz Navidad than I know. He keeps saying he wants a baby sister but we’ll see how it goes.
Trips
We took a few trips this year: We all took Amtrak to Washington D.C. for a week in May/June. I had a work conference there and Pamela and Maxwell came along. We got to see the sights and met up with Kate, Kevin and Ann, friends of mine from high school. Went to the Smithsonian Museum of Natural History, which was pretty cool. Bought a bunch of rocks as souvenirs. Flew back, Maxwell’s first time on a plane. He did fine — didn’t really realize what was going on, I think.

Also went back to Danville in July for my aunt’s birthday party. The hot-air balloon festival happened to be going on then too, so we went out to the airport to see that. Also went back in November for Thanksgiving, instead of for Christmas, because of the new baby.
Not really an out of town trip, but we did go over to Columbia, Ill. to see the eclipse. I really enjoyed it. Not sure how to put it into words.
Went on a couple other work trips.
Home improvement
Got some work done around the house: Took a tree down in the backyard that was pushing the fence into the neighbor’s yard and got the one in front pruned. Also cleared out much of the invasive honeysuckle bush along the back fence, hoping to plant a hedge there in the spring. My friend Katheryn offered us a swingset that her kids had outgrown, so Pam’s parents and we went over there to break it down. Put it up in our backyard a couple weeks later when my parents came to visit, so my dad could help. Finally got the deck on the back of the house replaced. Also working on getting the upstairs in shape to move some of the kids’ toys up there and make a little more room for us down here.
Hobbies

Played board games with friends a few times, and learned some new ones: Good Cop, Bad Cop; Arboretum (both played with Barb and Jim); Tiny Epic Galaxies (which I got for Christmas); Lost Cities (which Pam got for Christmas); Tournament at Camelot (bought for a game night with Barb and Jim). Also built a couple Kallax shelves from IKEA to hold our games and books and such to replace some decade-or-more old shelves we had in the dining room.
Didn’t golf at all. Pamela did a bit, but I don’t think I got my clubs out once, even to go to the driving range. I did take up woodcarving for a couple weeks. When I was clearing out the yard I got a branch that I thought might make a good walking stick, and rather than leave the bark on as I did last time, I stripped it. I then got it in my head that it might be nice to carve a design into it. I picked up a basic set of chisels and a hunk of basswood (which I later found out is also Linden, which is coincidentally one of the trees I have) to practice with. Didn’t really get anywhere with it (I have block of wood with something roughly approximating a leaf in low relief on top), but I still have the walking stick branch in the basement so maybe next year.
Kept on singing with Greenleaf. I handled our contract for the Renaissance Faire, which went okay. They insisted on five weekends, which was a bit overwhelming for our group. We took on a couple extra singers just for faire which helped immensely. We also finally nailed things down for a recording and did that in September. Got to sing at Eliot after missing it last year for Pete’s wedding. Also did our concert at Prince of Peace, did the St. Charles Christmas Traditions parade again and sang at the Daniel Boone House in an old chapel lit entirely by candlelight.
Got a new iPad (the 9.7″ iPad pro), and upgraded my phone from a 6 Plus to an 8 Plus. Also backed a Kickstarter by Loog and got a cherry red 3-string electric guitar. Kid likes it too. Got a macro lens for my camera for Christmas and I’m having a great deal of fun with it so far.
Arts
Read fewer books than I should. Borrowed Raven Rock after hearing an NPR interview with the author. It’s about Cold War preparations in the U.S. for nuclear war. Quite thorough, and interesting. I enjoyed it. I also read Jonathan Franzen’s The Corrections and liked it.
I got to see Chris Thile when he came to the radio station to play a show. I met him before he played and told him how much I enjoyed his hosting of The Show Formerly Known as A Prairie Home Companion (it wasn’t “Live From Here” yet) as well as his collaboration with Brad Mehldau, which I’d been listening to a lot of. I’ve mostly just kept up with podcasts — Merlin’s (Back to Work, Reconcilable Differences, and I started listening to Do By Friday), Marco’s (ATP and Under the Radar) and Pete’s (How to Be Awesome at Your Job) as well as some others (99% Invisible, Broadway Backstory, Mortified, The Moth, The Omni Show, etc.). Also S-Town.
In live theater, there wasn’t much. Pamela and I saw The Moth on stage at The Sheldon when our station brought them in, and then I saw my friend Ann in New Line’s The Sweet Smell of Success. That’s about it, really — I need to see more shows.
Food/Booze

Most notably, I got to try some Pappy Van Winkle 12-year at the Royale in January. Pam had taken Maxwell up north to visit her grandparents, leaving me behind. There was a big ice storm here. Steven Smith posted a photo of the bottle on Twitter, saying “A good reason to leave the house. It won’t last long.” I was there in 10 minutes.
In other booze news, I nabbed some 2017 Urban Chestnut Wolpertinger and the 2017 release of the Bourbon County Brand Stout.
I had several notable meals. Anew, an event space near my job, had several “test kitchen/popup” things this year. I went to one in March put on by The Social Affair with some delicious biscuits and gravy. Then there was one in December by Café Osage, where I had a pork schnitzel sandwich on challah bread. Both delicious. And a new place opened up down the street from work, inside KDHX: Squatters Café. I’ve only been twice, but each time has been great.
Work
Did some stuff at work. Lots of staff turnover. A couple trips. Lots of stuff to look forward to.
Projects
Probably the biggest project I worked on was our Millennium Mayor project. It was a limited-run podcast focusing on a handful of days in the tenure of Mayor Slay, at the end of his run. I made a stand-alone website for it, and it turned out not too bad, I think (mostly because of the content, not my work, but still).
Also put together a one-page mayoral candidates guide for the primary race that I particularly liked how it came together.
Did a thing where we graded Missouri legislators. It was…okay. I like the idea, but there’s so much intangible that it would take a lot more human intervention to do well than we allowed for it.
Published our “NFL Tweets” project — an idea by a reporter to ask who St. Louisans were tweeting about in the NFL since the Rams left. It also turned out alright — my largest dataset in a project to date. But that data came with some shortcomings that made it tough to draw conclusions from.
Also did election graphics (of course), census graphics, a timeline of the East Saint Louis riots and a quiz to help figure out if you have the right ID to vote.
Trips
Kicked off the year with a trip to Jacksonville, Florida for NICAR 2017. Good times. The hotel was a bit less conducive to hanging out than in prior years, but overall it was great. It’s always nice to be able to hang out with the folks I usually only ever see online. I also remember the river was just outside half of the conference rooms, so you could see the boats going by.
In May/June I got to go on the aforementioned trip to D.C. for the Education Writers Association conference because We Live Here’s stories on racial disparities in suspensions was nominated for an award, and they asked me to present on it. I got to be on a panel with Nathaniel Lash, who presented on his Pulitzer Prize-winning project Failure Factories.

And in July, I filled in for coworkers at the Missouri Urban Journalism Workshop, a week-long “journalism camp” for high-schoolers at Mizzou. Most of the other instructors had some connection to Mizzou, but not me. Still, I had a good time and it was refreshing to get my head out of the code and get back to basics again. Also I got to meet some friends from KBIA for the first time, so that was nice also.
Drone
Toward the end of 2016, when the FAA was getting ready to enact Part 107 to make commercial drone use easier, I went to a boot camp to learn what I needed to learn to get licensed. I pushed to get one at work, but it never materialized. Until this year.
We got a donation earmarked for the purpose, so I took the Part 107 test (passed with a 95%), and spend the end of the year ordering, then testing the drone as well as putting together all our documentation and procedures about it. I’m presenting on it to the newsroom next week and am looking forward to using it in the coming year.
Other stuff
I got to meet and interview Jer Thorp when he was here installing a project of his called the St. Louis Map Room. It aired, one of a few times I’ve been on the radio. That was fun.
The same procedure as every year, James. https://youtu.be/zVd_VLO9xcc
WordPress remains inscrutable, but I just split off my microblog posts into their own page and it feels good.
Didn’t bring lunch to work today. Briefly considered getting Jimmy John’s delivered, then decided to walk down to Squatter’s Café instead. Rewarded with this delicious meatloaf sandwich on special.

Today’s macro: a bit of an amethyst geode.
